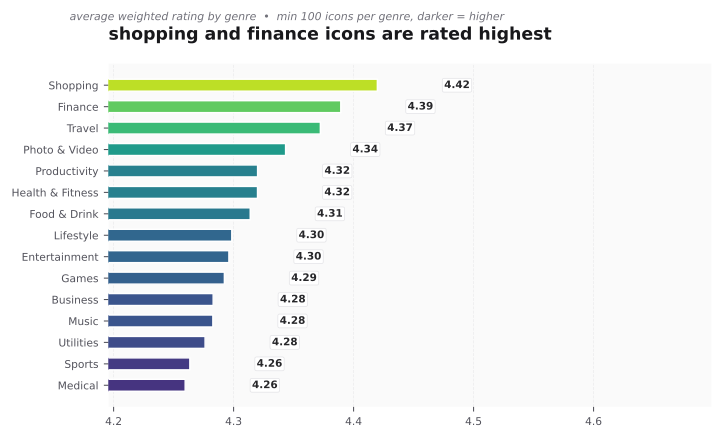
not all genres rate the same. we ranked every genre by average weighted rating. we only kept genres with at least 100 icons so the average is stable.
what we found
top five
- shopping 4.42 with 654 icons
- finance 4.39 with 723 icons
- travel 4.37 with 546 icons
- photo and video 4.34 with 338 icons
- productivity 4.32 with 388 icons
medical is last in this set at 4.25 with 677 icons. games is in the middle at 4.29 even though it is the largest genre with 917 icons.
popularity versus love
a bubble can show both at once. the x is average rating, the y is average rating count on a log scale, the size is how many icons are in the genre, the color is saturation.
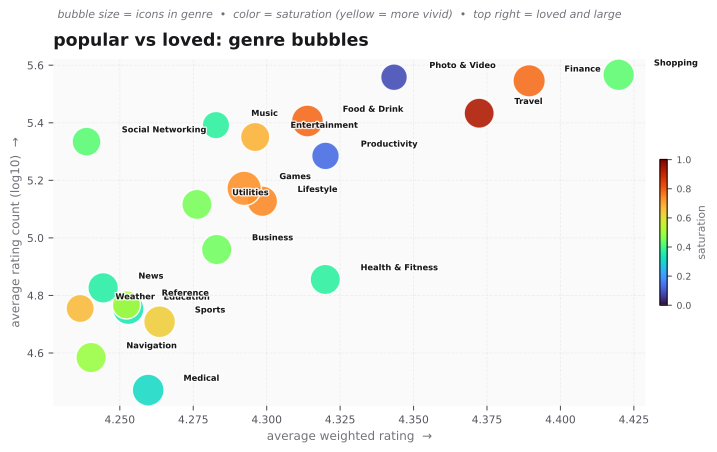
shopping sits to the right and high up. it is both loved and has many ratings. finance and travel are close. medical is left and low, which means lower rating and fewer ratings on average. the chart also shows that more saturated genres are not always top rated, so saturation alone does not explain love.
why the top looks like that
shopping, finance and travel need trust. their icons often use clear glyphs, calm white space and a restrained palette. that premium feel matches the job of the app. they also have high rating counts, shopping averages 368k ratings, so good design gets rewarded at scale.
what you can do
- study the top of your own genre, not the global top. taste changes by category.
- if you design for medical or reference, the average is lower. a sharper icon can lift you faster.
- always filter by genre in iconhub and compare within that genre before you judge globally.